A few notes about CPU load and resource consumption

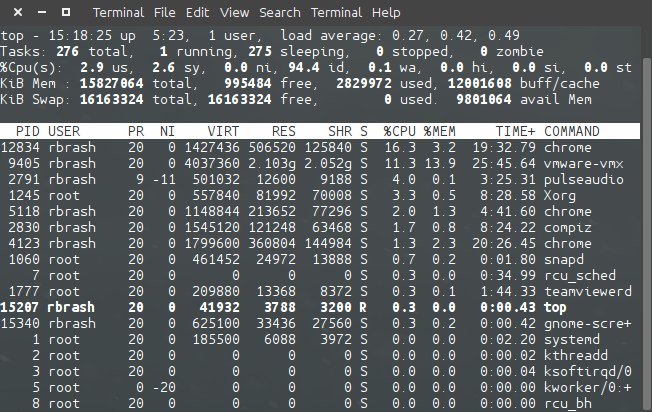
A few observations about looking at TOP that I hear people asking are regarding what does the % mean, and why can I have over 100% when looking at CPU usage.
Well, its sort of simple. Load averages are the average of the load number for a process in a given period of time. A load number is merely a metric that is an average that takes into account CPU usage (or consumed time-slices) by the process. These could be:
- Operational (active) processes running on the CPU
- Runnable, but waiting (could be waiting on a spin-lock
- Sleeping (e.g., waiting/blocked on IO)

I won't delve into how the arithmetic of how the values are calculated, but there is an important note here: CPU usage can be over 100%. What!? The idea is (and its also due to the age of the tool) that the value is divisible by the number of cores you may have. If the usage is 100% and you have two cores, only 50% of the total overall CPU time was used (or 50% was free).
Other notes are, make sure to analyse trends in utilisation. Short term "bursts" can be for a variety of reasons such as the spawning of a process or a bulk operation, but increasing trends should be more worrisome.
When looking at a specific process's memory consumption:
Name: chrome
State: S (sleeping)
Tgid: 12834
Ngid: 0
Pid: 12834
PPid: 4242
TracerPid: 0
Uid: 1000 1000 1000 1000
Gid: 1000 1000 1000 1000
FDSize: 256
Groups: 4 24 27 30 46 113 128 1000
NStgid: 12834 4611 1
NSpid: 12834 4611 1
NSpgid: 2830 0 0
NSsid: 2830 0 0
VmPeak: 1682320 kB
VmSize: 1440936 kB
VmLck: 0 kB
VmPin: 0 kB
VmHWM: 516592 kB
VmRSS: 458988 kB
VmData: 964456 kB
VmStk: 132 kB
VmExe: 109420 kB
VmLib: 57060 kB
VmPTE: 2184 kB
VmPMD: 500 kB
VmSwap: 0 kB
HugetlbPages: 0 kB
Threads: 25
SigQ: 0/61639
SigPnd: 0000000000000000
ShdPnd: 0000000000000000
SigBlk: 0000000000000000
SigIgn: 0000000000001002
SigCgt: 00000001c0014a25
CapInh: 0000000000000000
CapPrm: 0000000000000000
CapEff: 0000000000000000
CapBnd: 0000003fffffffff
CapAmb: 0000000000000000
Seccomp: 2
Cpus_allowed: ff
Cpus_allowed_list: 0-7
Mems_allowed: 00000000,00000001
Mems_allowed_list: 0
voluntary_ctxt_switches: 554217
nonvoluntary_ctxt_switches: 8082
I tend to look at these variables:
VmRSS: 458988 kB
VmData: 964456 kB
VmStk: 132 kB
VmExe: 109420 kB
VmLib: 57060 kB
For more information about these variables, please see this excellent answer on Quora
Add new comment